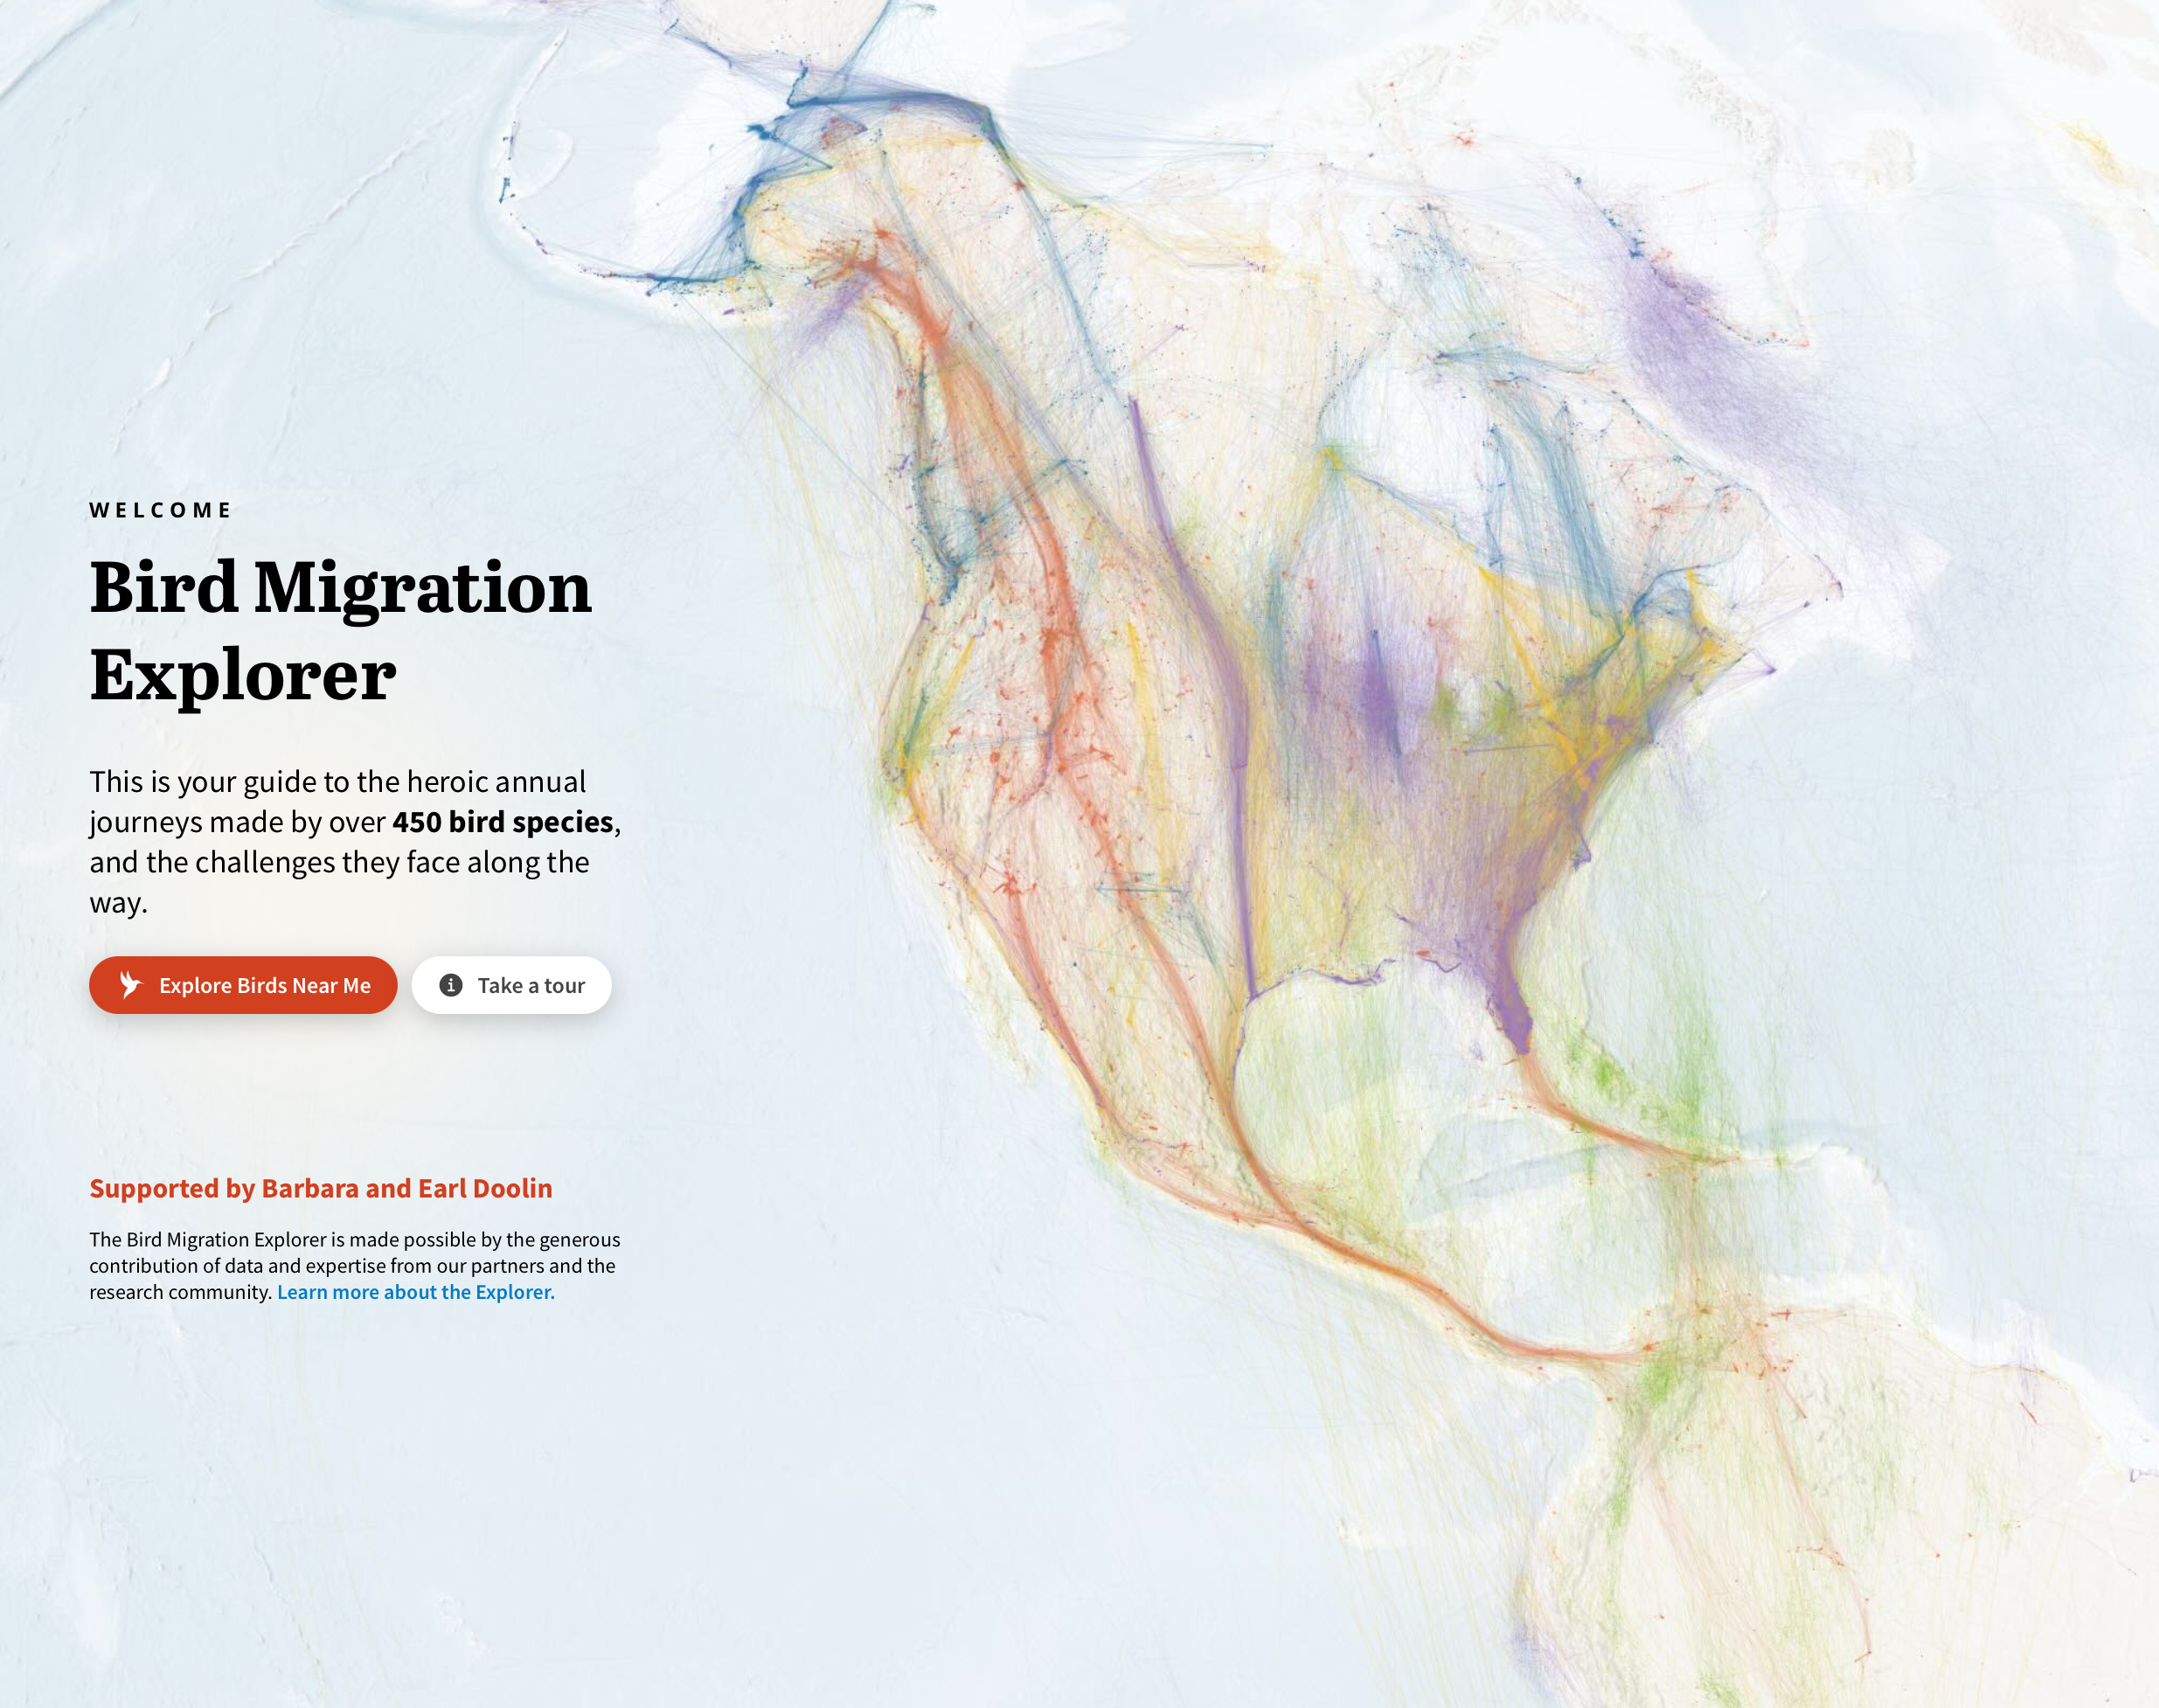
"The Bird Migration Explorer shows bird migrations that you can explore. Each color represents a type of migratory bird, such as landbirds in green and shorebirds in yellow."
"I'm into the color pencil aesthetic. Although my computer buckled in interaction mode. I believe if you are on a newer computer, you can hover over the paths to get more information about each bird type's journey."
"FlowingData Delivered to Your Inbox"
The Bird Migration Explorer visualizes migratory routes and uses color to differentiate bird groups. Colors correspond to bird types, for example green for landbirds and yellow for shorebirds. The interface supports interactive exploration where hovering over paths reveals journey details when run on newer computers. Some systems may experience performance issues in interaction mode, causing instability on older machines. A color pencil visual style influences the map's aesthetic. Users can explore the distinct paths and color-coded groupings to learn migration patterns. The content is associated with FlowingData and can be delivered via email subscription.
Read at FlowingData
Unable to calculate read time
Collection
[
|
...
]