"The AUC results for tumor detection at magnification 5x showed limited classification effectiveness, prompting the exclusion of related heatmaps due to poor performance."
"Attention scores from the AMIL model indicated which patches were most relevant for predictions, while the AdMIL variant provided scores that showed both excitatory and inhibitory contributions."
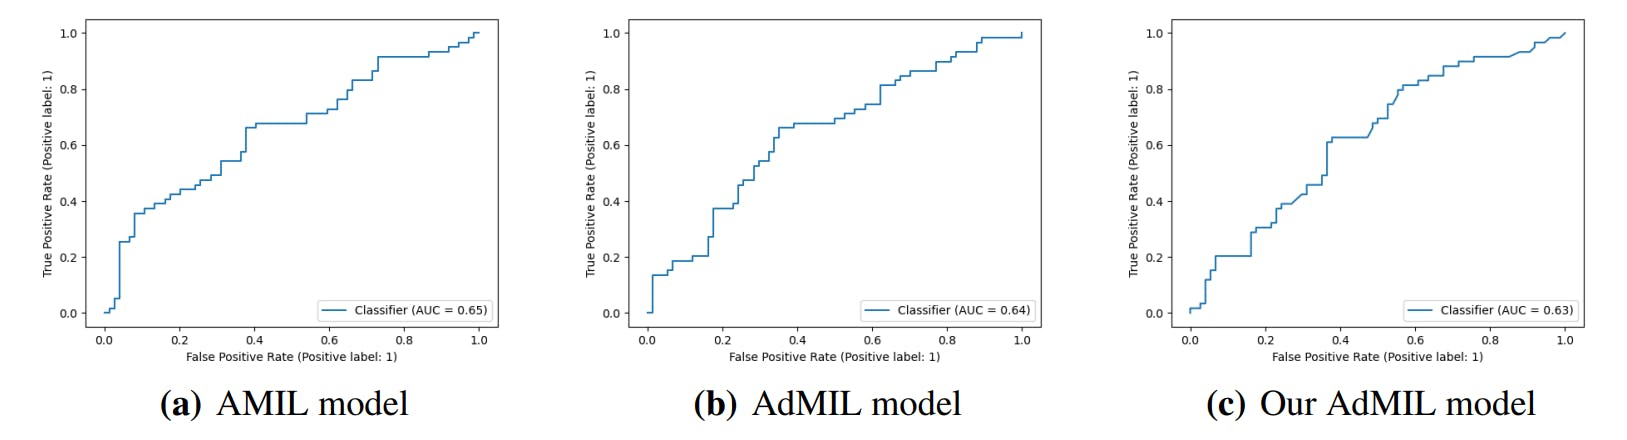
"ROC curves illustrate model performance across independent runs for each task and magnification level, demonstrating varying effectiveness in tumor and gene mutation detection."
"Final scores from the attention layer were transformed using sigmoid scaling, categorizing contributions as negative or positive, influencing the heatmap representations for analysis."
Classification tasks yielded various AUC results across different magnification levels, particularly showing limited effectiveness at 5x for tumor detection. Average and standard deviation AUC results were presented for independent runs. Attention scores for models indicated the relevance of patches in predictions. Heatmaps produced at different magnifications illustrated detection tasks. Values from the attention layer were scaled to identify negative and positive contributions, dictating the heatmap color representations for improved visual analysis. Poor results at magnification 5x for tumors led to the decision to exclude meaningful visualizations.
Read at Hackernoon
Unable to calculate read time
Collection
[
|
...
]