"New CSS features can sometimes make it easier and more efficient to code designs we already knew how to create. This efficiency could stem from reduced code or hacks, or improved readability due to the new features. In that spirit, let's revamp what's under the hood of a bar chart. We begin by laying out a grid. .chart { display: grid; grid-template-rows: repeat(100, 1fr); /* etc. */ } The chart metric is based on percentage, as in "some number out of 100." Let's say we're working with a grid containing 100 rows. That ought to stress test it, right?"
"Right off the bat, I want to note a couple of things. First is that sibling-index() function. It's brand new and has incomplete browser support as of this writing (come on, Firefox!), though it's currently supported in the latest Chrome and Safari (but not on iOS apparently). Second is that function. We've had it for a while, but it was recently upgraded and now accepts data-attributes. So when we have one of those in our markup - like data-value="32" - that's something the function can read."
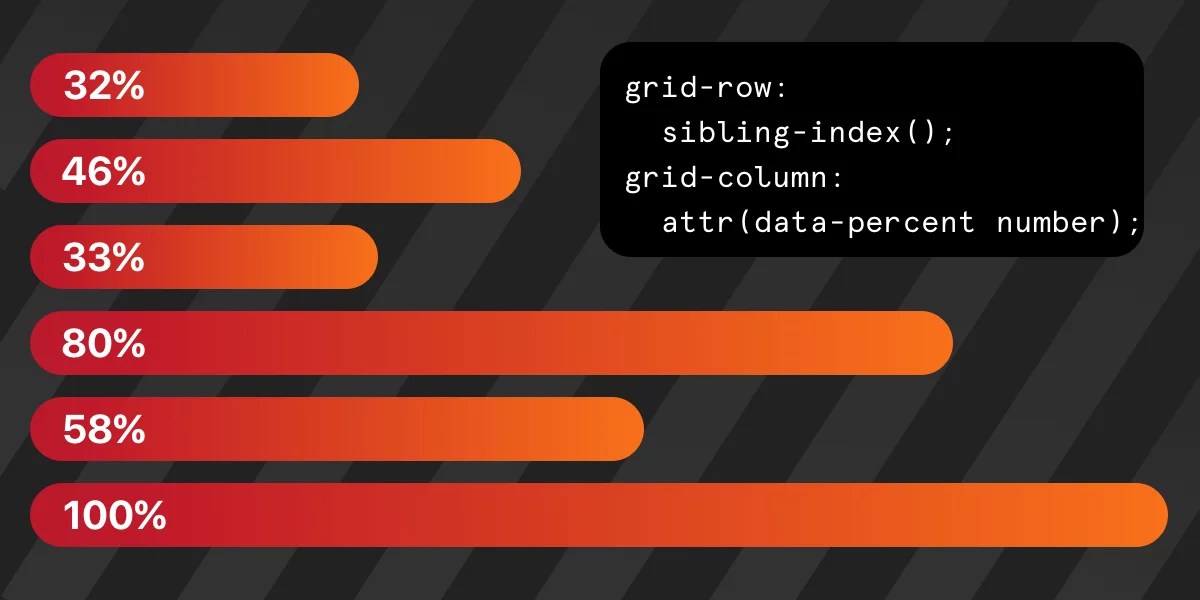
New CSS capabilities reduce code and improve readability while enabling pure-CSS charts. A grid defined with grid-template-rows: repeat(100, 1fr) models percentage metrics as rows representing 0–100. Bars are positioned via grid-column: sibling-index() and grid-row: span attr(data-value number), letting each bar occupy rows equal to its data-value. sibling-index() places list items into consecutive columns and now accepts data-attributes after a recent upgrade. Support is partial — supported in latest Chrome and Safari but not universally — so demos include fallbacks. The method yields declarative bar charts with minimal markup and no JavaScript.
Read at CSS-Tricks
Unable to calculate read time
Collection
[
|
...
]