Washington DC
fromSFGATE
2 weeks agoReal Estate Market Trends in Washington, DC: Prices Fall
DC's housing market is experiencing a significant shift with falling prices and fewer listings, impacting buyers and sellers alike.
Inventory on the Rise In December, Virginia Beach experienced an 8.2% increase in active listings compared to the previous year, bringing the total to 749 homes on the market. While this rise in inventory was more modest than the national average of 12.1%, the market saw a remarkable 38.6% year-over-year surge in newly listed homes, with 366 properties entering the scene. This substantial influx signaled a vibrant and dynamic market, teeming with opportunities for sellers to capitalize on increased buyer interest.
Minneapolis experienced a 6.4% rise in active listings compared to December of the previous year, totaling 690 homes. Although this increase was more modest than the national growth of 12.1%, the city still offered a wider array of options for buyers. With just 180 newly listed homes, the year-over-year decline of 14.3% suggested a unique chance for buyers to explore less competition and potentially find hidden gems in this active market.
In December, Memphis saw its active listing count soar to 2,123, marking an impressive 20.7% increase compared to the same time last year. This was a significant rise above the national increase of 12.1%. While the number of newly listed homes in Memphis dipped to 446, a 9.3% decrease from the previous year, the overall swell in inventory signaled that homes were lingering on the market longer, creating a prime environment for buyers to explore their options.
In December, El Paso experienced an impressive surge in its active listing count, reaching 2,355 properties. This represented a substantial year-over-year growth of 15.7%, well ahead of the national inventory growth rate of 12.1%. With 562 newly listed homes, marking a 17.6% increase from the previous year, sellers showcased their enthusiasm to join the market. This robust influx of new listings, combined with the rise in active listings, underscored a unique opportunity for sellers to capture buyer interest.
In December, Albuquerque's active listings rose by an impressive 8.3% compared to the same month last year, totaling 1,065 homes. While the national active listing count grew by a higher 12.1%, Albuquerque's inventory expansion was commendable, with 392 newly listed homes marking a 3.2% year-over-year increase. This surge in new listings, against a national decline of 1.8%, highlighted Albuquerque's potential for sellers eager to meet the active demand.
In May, home prices rose substantially from the month before, with a median listing price of $281,250. The number of listings on the market grew 7.4%, which is a bigger increase than normal for this time of the year in Kansas City, and homes are also selling slower than at the same time last year. Home prices in Kansas City Typically, home price per square foot in Kansas City tend to rise in May.
The number of listings on the market grew 6.1% from last month, which is a smaller increase than normal for this time of the year in Tulsa, and homes are also selling close to the same pace as the same time last year. Typically, home price per square foot in Tulsa tend to rise in July. But the most recent data shows that the price per square foot decreased by 0.6% compared with the month before.
In November, home prices rose moderately from the month before, with a median listing price of $299,900. The number of listings on the market remained practically unchanged from last month, but it is a bigger increase than normal for this time of the year in El Paso, and homes are also selling slower than at the same time last year.
In November, home prices remained unchanged from the month before, with a median listing price of $345,000. The number of listings on the market shrank 5.4% from last month, which is a bigger decrease than normal for this time of the year in Fort Worth, and homes are also selling slower than at the same time last year. Typically, home price per square foot in Fort Worth tend to rise in November. And the most recent data shows that the price per square foot remained practically unchanged compared with the month before.
Typically, home price per square foot in Nashville tend to fall in November. But the most recent data shows that the price per square foot remained practically unchanged compared with the month before. So, how does this compare with the rest of the U.S.? Nationally, home price per square foot decreased 1.2%, which means price changes in Music City are outpacing the national market.
Home prices in Seattle Typically, home price per square foot in Seattle tend to fall in October. And the most recent data shows that the price per square foot decreased by 0.7% compared with the month before. So, how does this compare with the rest of the U.S.? Nationally, home price per square foot decreased 0.8%, which means price changes in the Emerald City are keeping pace with the national market.
In October, home prices remained unchanged from the month before, with a median listing price of $285,000. The number of listings on the market remained practically unchanged from last month, but it is a smaller increase than normal for this time of the year in Philadelphia, and homes are also selling close to the same pace as the same time last year.
In October, home prices fell moderately from the month before, with a median listing price of $289,950. The number of listings on the market remained practically unchanged from last month, but it is a smaller increase than normal for this time of the year in Jacksonville, and homes are also selling slower than at the same time last year. Home prices in Jacksonville
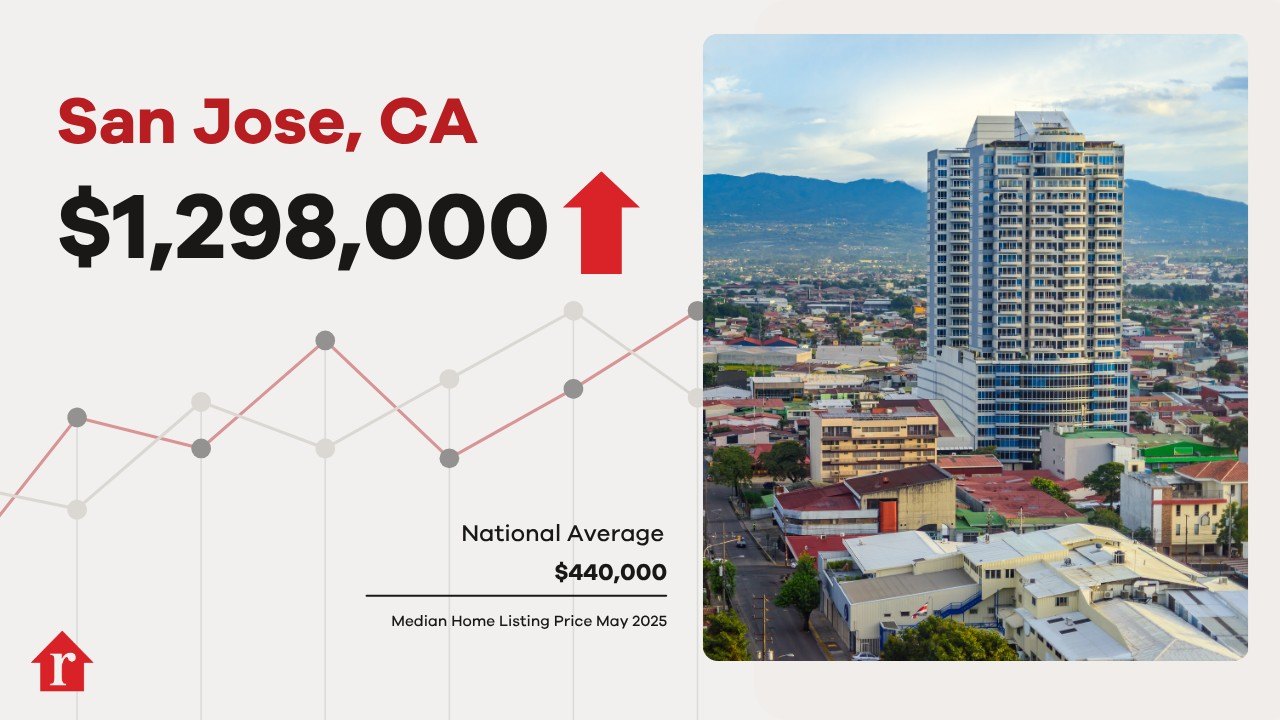
In October, home prices fell slightly from the month before, with a median listing price of $1,193,694. The number of listings on the market shrank 4.9% from last month, which is a bigger decrease than normal for this time of the year in San Jose, and homes are also selling slower than at the same time last year. Typically, home price per square foot in San Jose tend to fall in October.
In September, home prices fell moderately from the month before, with a median listing price of $480,000. The number of listings on the market grew 1.6% from last month, which is a smaller increase than normal for this time of the year in Mesa, and homes are also selling slower than at the same time last year. Home prices in Mesa Typically, home price per square foot in Mesa tend to rise in September.
Camp Hill, Pennsylvania, has earned a spot on the Realtor.com® 2025 Hottest ZIP Codes list, placing this Harrisburg suburb among the most competitive housing markets in the nation. Each year, the rankings highlight ZIP codes where homes are selling faster than the U.S. average and pulling in more online attention from buyers.