Node JS
fromgithub.com
2 weeks agowebllm/webblackbox: A Web Blackbox
WebBlackbox records web app interactions and errors, allowing for detailed session replay and debugging.
"Any exposure of source code or system-level logic is significant, because it shows how controls are implemented. In AI systems, that layer is especially critical. The orchestration, prompts, and workflows effectively define how the system operates. If those are exposed, it can make it easier to identify weaknesses or manipulate outcomes."
This video course will teach you how to use Gemini CLI to bring Google's AI-powered coding assistance directly into your terminal. After you authenticate with your Google account, this tool will be ready to help you analyze code, identify bugs, and suggest fixes-all without leaving your familiar development environment. Imagine debugging code without switching between your console and browser, or picture getting instant explanations for unfamiliar projects.
Daggr allows developers to define workflows programmatically in Python while automatically generating a visual canvas that exposes intermediate states, inputs, and outputs for each step in the pipeline. Daggr simplifies applied AI development by organizing workflows as directed graphs, allowing for independent inspection and re-execution of each node. This method enhances debugging and speeds up iteration by tackling the issue of slow and unclear experimentation,
AI tools often produce code that compiles and runs, but contains subtle bugs, security vulnerabilities, or inefficient implementations that may not surface until production. AI systems also lack a true understanding of business logic. They often create solutions that seem to work - but hide issues that aren't found until later. As developers are building solutions, the AI will most frequently cover common solutions but fail on edge cases.
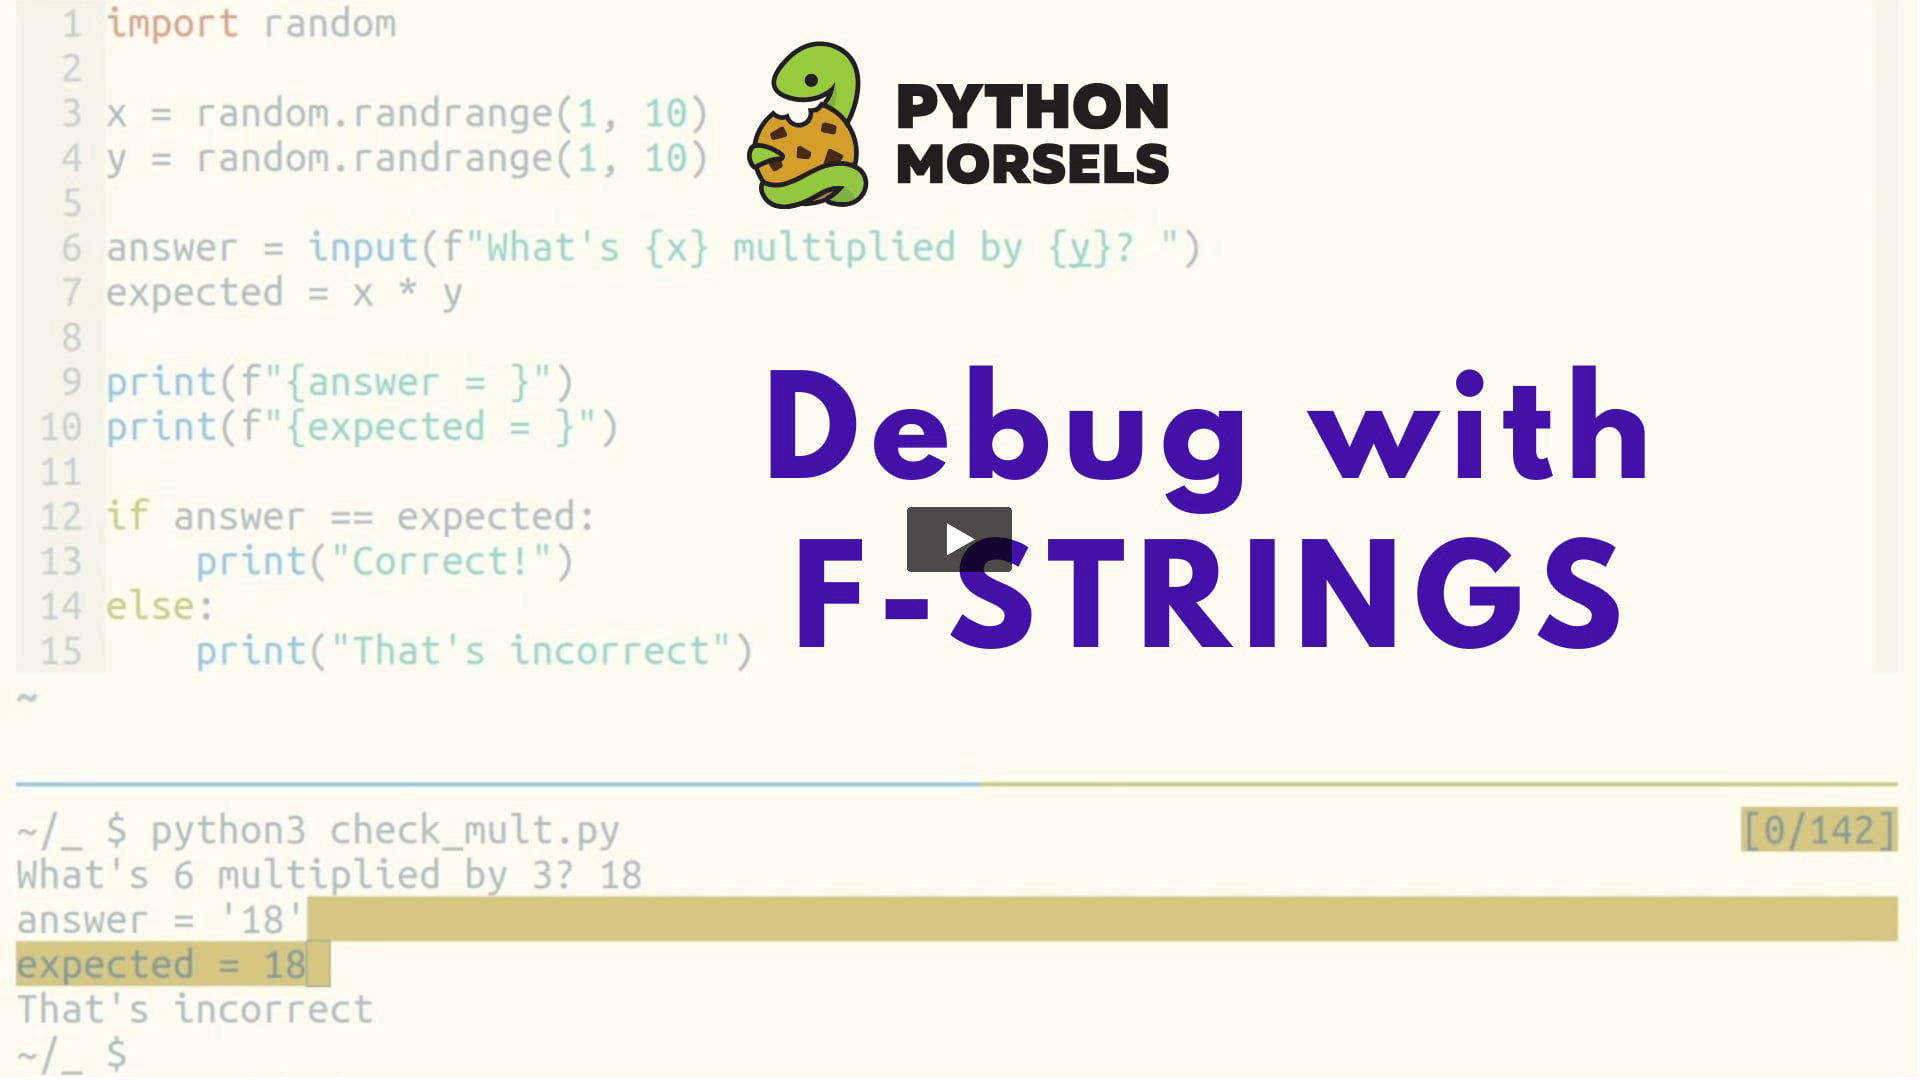
Have you ever had a facepalm moment when you're troubleshooting a problem, and suddenly a cause or solution you'd overlooked becomes obvious? You sheepishly realize you'd wasted time going down the wrong track. This happened to me recently. I was working on a coding project, and a small error was driving me batty. I kept asking an AI chatbot to fix my code, but none of the fixes solved it.
When code can be generated quickly, checking the correctness of the generated code becomes a major bottleneck, shifting priorities between system efficiency and programmer effort.
"We hired a bunch more people at OpenAI who are really great at debugging, and I think those are some of our most-prized employees, and I won't even..."