#housing-inventory
#housing-inventory
[ follow ]
#mortgage-rates #home-prices #days-on-market #high-mortgage-rates #existing-home-sales #new-home-sales


fromwww.cbc.ca
1 month agoCanada's benchmark home price fell 4.8% in February | CBC News
What we've seen so far is that home resales are still fairly sluggish. Those trends are primarily impacting Ontario and B.C., but we're starting to see some moderation in other parts of Canada as well, including parts of Alberta and Quebec, where smaller and mid-sized housing markets were hot in the second half of last year.
Canada news
Real estate
fromwww.housingwire.com
1 month agoThe senior housing bottleneck is a mortgage market issue hiding in plain sight
Older homeowners are staying in place longer due to structural systems issues, rate lock-in, and complex life transitions rather than sentiment, creating a significant slowdown in housing inventory release.


Real estate
fromwww.housingwire.com
2 months agoBarry Habib, Logan Mohtashami say housing market set for pent-up demand surge
Housing inventory remains constrained; capital gains adjustments may increase listings temporarily but not long-term supply, while tariff rulings could raise debt issuance and pressure bonds.


fromSFGATE
2 months agoReal Estate Market Trends in Seattle, WA: Prices Fall - December 2025
In December, Seattle dazzled with an active listing count of 1,566, showcasing an impressive 27.8% surge compared to the same month last year. This was more than double the national growth rate of 12.1%. The number of newly listed homes in Seattle edged up by 0.7% year-over-year, bucking the national decline of 1.8%. This significant rise in inventory unveiled a more balanced market, providing buyers with an enticing array of home selections.
Real estate
fromSFGATE
2 months agoReal Estate Market Trends in Memphis, TN: Prices Fall - December 2025
In December, Memphis saw its active listing count soar to 2,123, marking an impressive 20.7% increase compared to the same time last year. This was a significant rise above the national increase of 12.1%. While the number of newly listed homes in Memphis dipped to 446, a 9.3% decrease from the previous year, the overall swell in inventory signaled that homes were lingering on the market longer, creating a prime environment for buyers to explore their options.
Real estate

Boston real estate
fromBoston Condos For Sale Ford Realty
3 months agoWill We See A 'Silver Tsunami' Of Boston Condo For Sale Listings? Boston Condos For Sale Ford Realty
The expected baby-boomer-driven surge in publicly listed homes is not occurring; inventory remains muted due to inheritances, aging-in-place, geographic mismatch, and equity.
fromSFGATE
3 months agoOmaha Home Prices Down in July
In July, home prices fell substantially from the month before, with a median listing price of $353,950. The number of listings on the market grew 27%, which is a bigger increase than normal for this time of the year in Omaha, and homes are also selling faster than at the same time last year. Typically, home prices in Omaha tend to fall in July. And the most recent data shows that the price per square foot decreased by 0.5% compared with the month before.
Real estate


fromSFGATE
4 months agoBaltimore Home Prices Down in November
In November, home prices fell substantially from the month before, with a median listing price of $240,000. The number of listings on the market remained practically unchanged from last month, which is typical for this time of the year in Baltimore, and homes are also selling close to the same pace as the same time last year. Home prices in Baltimore Typically, home price per square foot in Baltimore tend to fall in November.
Real estate
fromFast Company
4 months agoHousing market inventory is still rising-but the pace of growth is slowing
Between November 2023 and November 2024, U.S. active housing inventory for sale rose +26.1%. Between November 2024 and November 2025, U.S. active housing inventory for sale rose +12.6%. Some of that percentage deceleration is a denominator effect (i.e., as U.S. active inventory rises, it takes an even larger increase to generate the same year-over-year percentage gain). That said, the deceleration is not only due to a denominator effect.
Real estate
fromwww.housingwire.com
5 months agoNew home price premium hits record low
Monthly payments for new and existing homes are now nearly equal, amid a trend of stagnating prices and increased use of mortgage buydowns among builders. That was one of the main findings from Realtor.com's Q3 New Construction Report. According to the report, buyers purchasing a new home last quarter had an average mortgage payment only about $30 more per month than those buying an existing home with less money down.
Real estate
fromSFGATE
5 months agoKansas City Home Prices Down in October
In October, home prices fell moderately from the month before, with a median listing price of $275,000. The number of listings on the market grew 3.0% from last month, which is a smaller increase than normal for this time of the year in Kansas City, and homes are also selling slower than at the same time last year. Typically, home price per square foot in Kansas City tend to fall in October.
Real estate
Real estate
fromBoston Condos For Sale Ford Realty
5 months agoPocket Listings Will Increase In 2026? Boston Condos For Sale Ford Realty
Pocket listings likely will not significantly increase in 2026 as overall housing inventory modestly improves, yielding a more balanced market with regional variation.
fromFast Company
5 months agoHousing market shift: 21 major markets seeing the strongest move toward buyers
Generally speaking, housing markets where inventory (i.e., active listings) has returned to pre-pandemic 2019 levels have experienced weaker home price growth (or outright declines) over the past 36 months. Conversely, housing markets where inventory remains far below pre-pandemic 2019 levels have, generally speaking, experienced more resilient home price growth over the past 36 months. Of the 50 largest metro area housing markets, 21 major metros now have more homes for sale than at the same point in 2019.
Real estate


Boston real estate
fromBoston Condos For Sale Ford Realty
6 months agoBoston Condos For Sale Best Time To Buy In A Decade Boston Condos For Sale Ford Realty
Greater Boston home prices stabilize while listings and active inventory rise, creating improved buying opportunities even as sellers still achieve strong results when priced right.
fromBoston Condos For Sale Ford Realty
6 months agoBoston Condo For Sale Prices Still Climbing Boston Condos For Sale Ford Realty
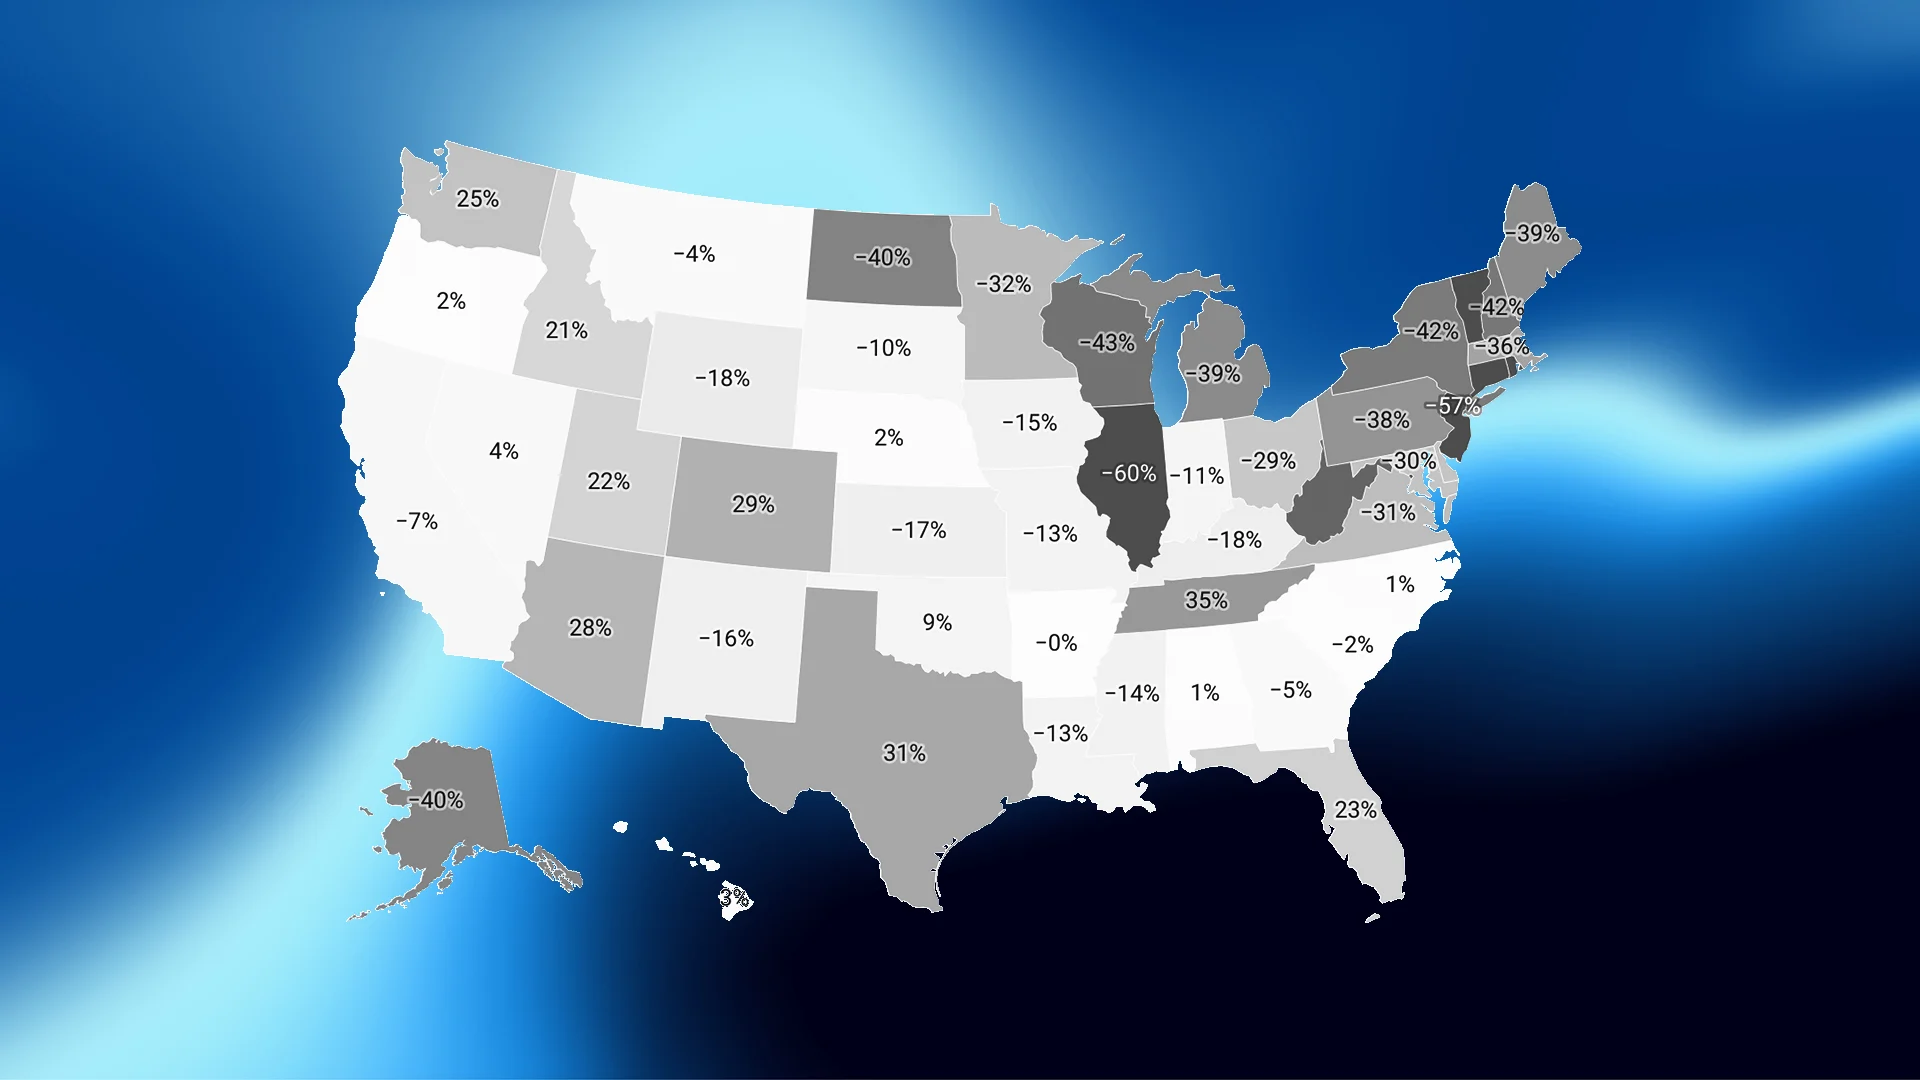
While we've definitely seen prices moderate from the rapid and unsustainable climb in 2020-2022, how much they've changed is going to be different everywhere. If you look at data from ResiClub and Zillow for the 50 largest metros, this becomes very clear. The real story is split right down the middle. Half of the metros are still seeing prices inch higher. The other half? Prices are coming down slightly ( see graph below).
Real estate
fromwww.housingwire.com
6 months agoTrump urges Fannie Mae, Freddie Mac to boost homebuilding
The two government sponsored enterprises buy loans from mortgage lenders to ensure liquidity in the market and repackage those into investment products. They also set the standards for creditworthiness and ability to repay for mortgage loans. While they offer several construction products, those support lenders and homebuyers, not builders. HousingWire Lead Analyst Logan Mohtashami has written extensively on what could trigger more homebuilding and weighed in on Trump's statement.
Real estate
fromFast Company
7 months ago80 housing markets cross a critical line-why that's good for homebuyers
During the pandemic housing boom, from summer 2020 to spring 2022, the number of active homes for sale in most housing markets plummeted as homebuyer demand quickly absorbed almost everything that came up for sale and home sellers had ultimate power. Fast-forward to the current housing market, and the places where active inventory has rebounded to 2019 levels (due to strained affordability suppressing buyer demand) are now the very places where homebuyers have gained the most power.
Real estate
[ Load more ]