fromInfoQ
13 hours agoDevOps
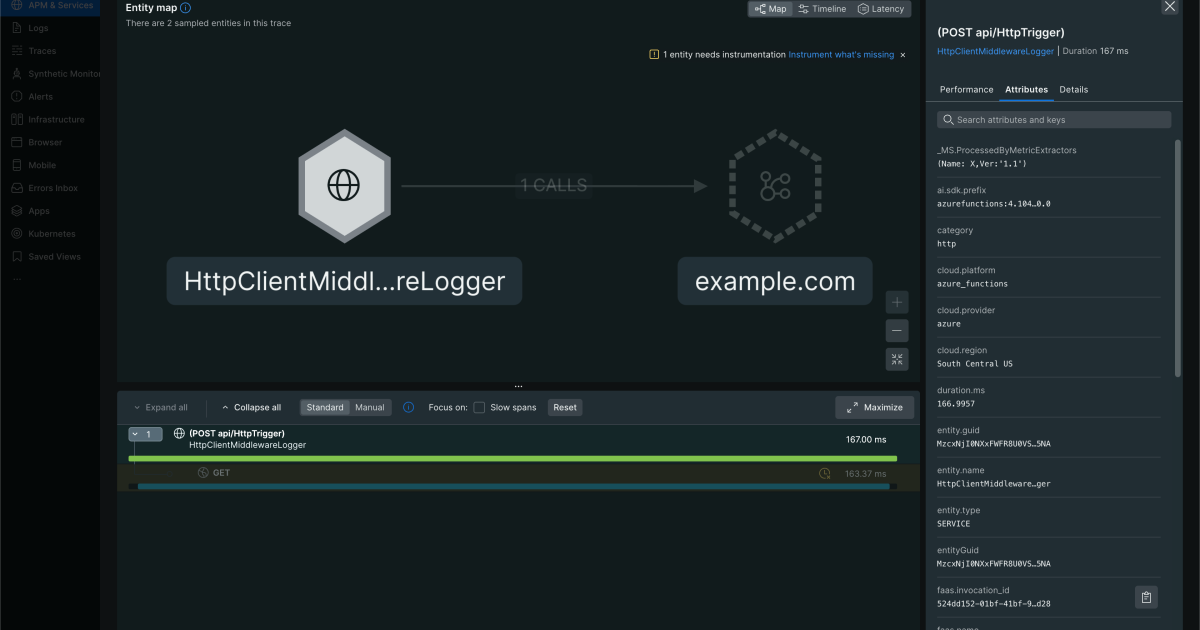
QCon London 2026: Uncorking Queueing Bottlenecks with OpenTelemetry
Distributed tracing with OpenTelemetry enables engineers to identify root causes across service boundaries by maintaining hierarchical visibility of operations, while SLOs based on latency provide more reliable alerting than infrastructure metrics.